EconomyExplainer
Core PCE hit 3.49% in September 2026 while core CPI showed 2.39%
The Fed's preferred inflation gauge updates faster, covers more spending, and responds quicker to how consumers actually behave. Here's what that means for reading economic news.
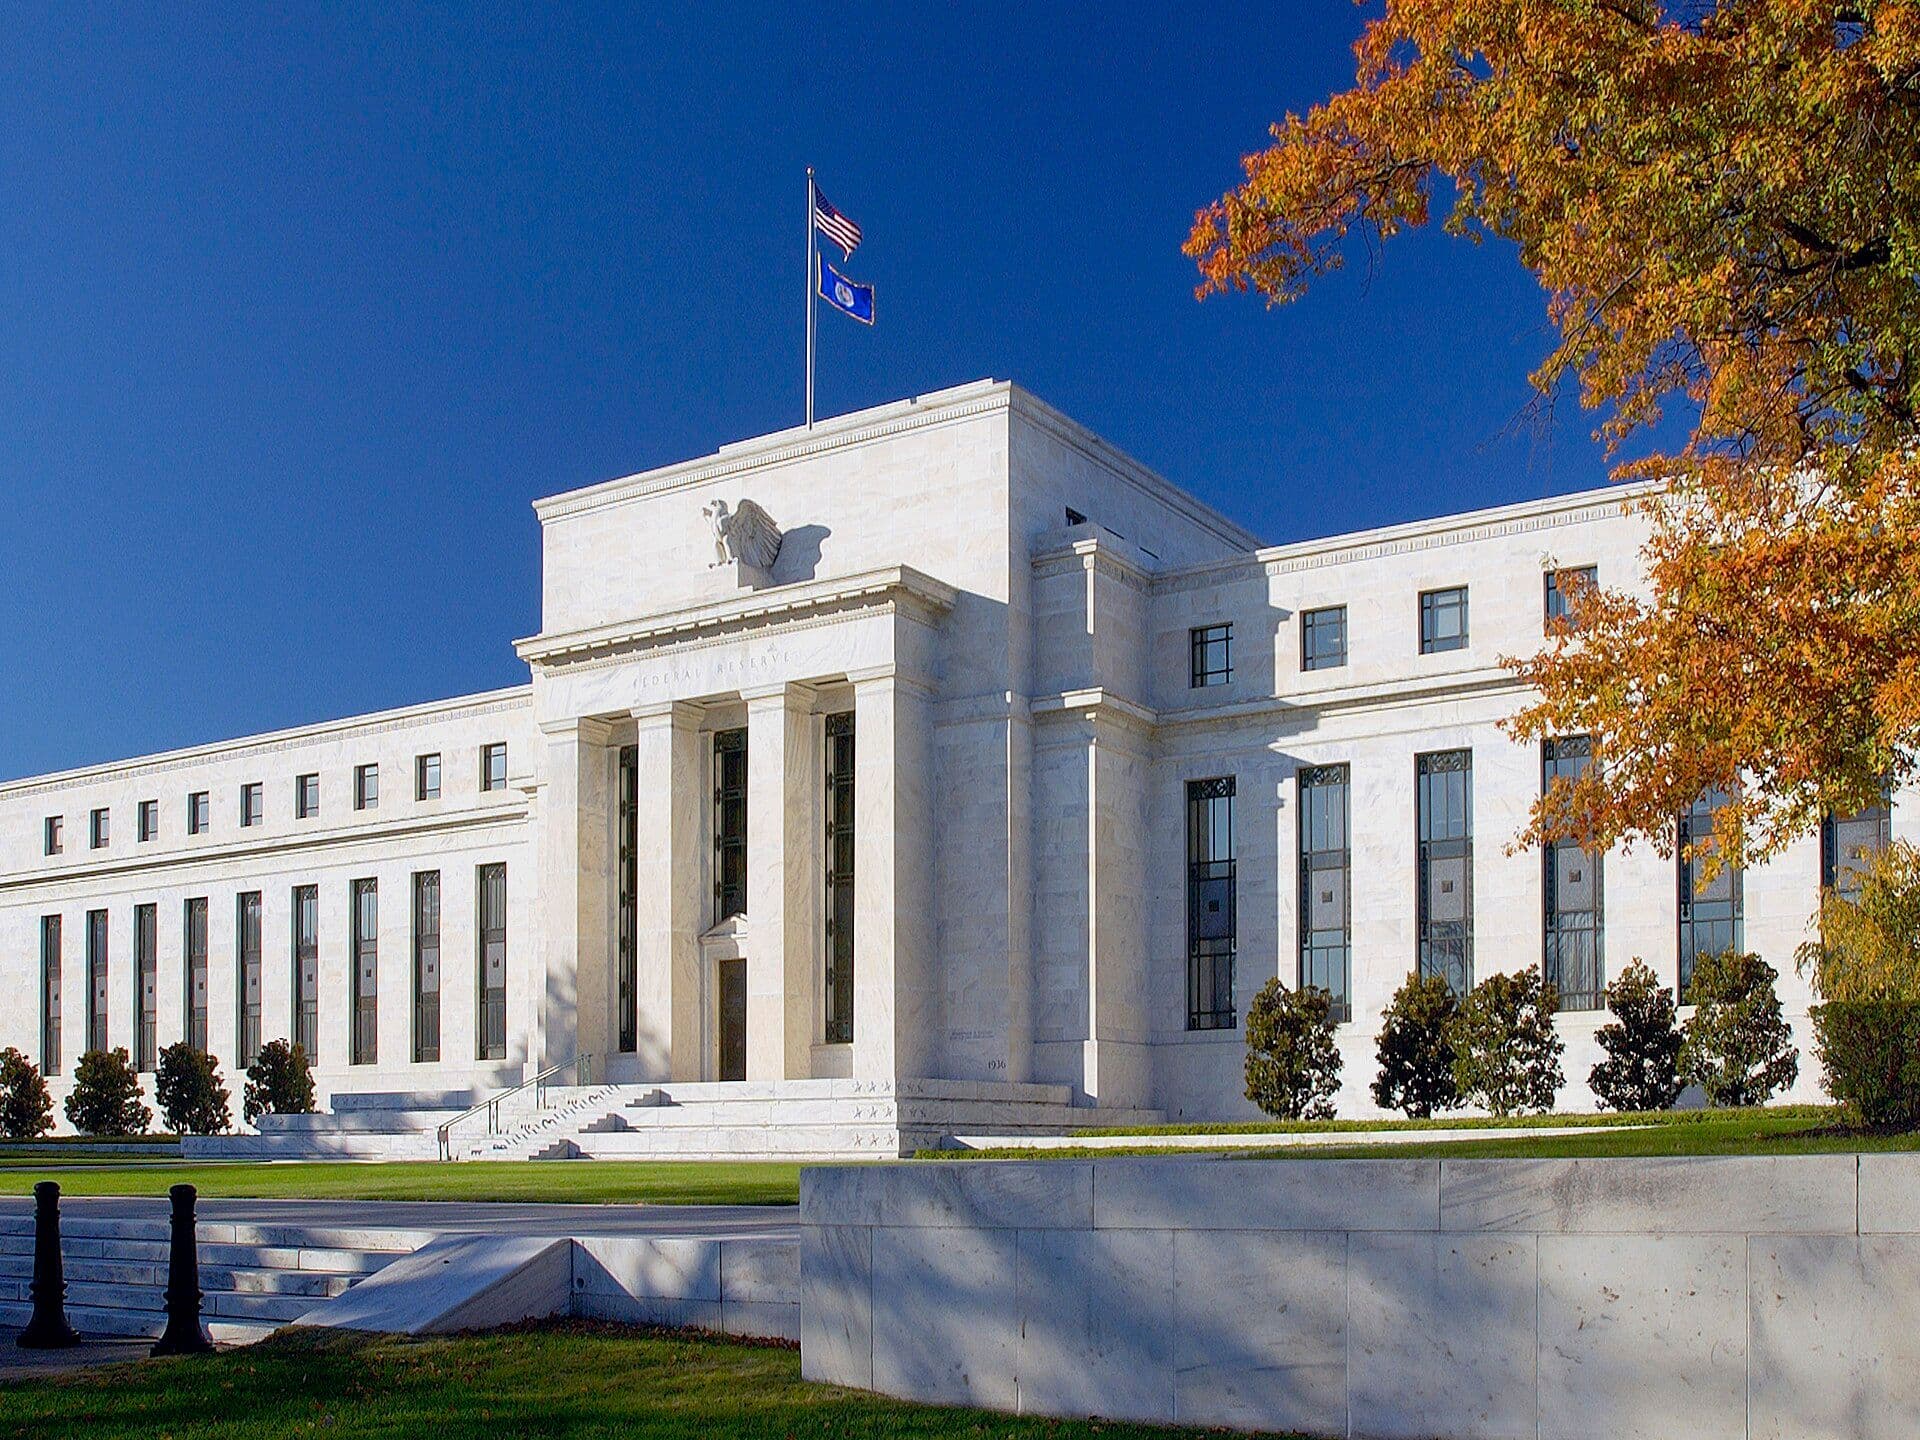
When inflation headlines hit, most Americans see the Consumer Price Index, or CPI. But the Federal Reserve ignores it. In January 2012, the Federal Open Market Committee formally adopted a 2 percent longer-run inflation target based on the Personal Consumption Expenditures price index, or PCE—not CPI. The two indexes tell fundamentally different stories about rising prices, and understanding why the Fed chose PCE explains how monetary policy actually responds to inflation signals that affect jobs, wages and interest rates.
The difference rests on how each index captures what Americans actually spend. The CPI measures what households spend their own money on—rent, groceries, gas, medical costs they pay directly. The PCE measures all spending on goods and services consumed by Americans, including healthcare that employers subsidize, insurance premiums that businesses pay on workers' behalf, and medical services that Medicare and Medicaid cover. That broader view, updated more frequently and adjusted for how consumers switch to cheaper goods when prices rise, lets the Fed track real inflation pressure better than the narrower CPI measure most news outlets report.
The practical impact is stark. In September 2026, core PCE ran at 3.49 percent year-over-year while core CPI sat at 2.39 percent—a gap of 110 basis points. The same month produced two conflicting inflation stories: one suggesting price pressures were nearly solved, the other suggesting they remained elevated. Which one the Fed reads determines monetary policy, which determines whether the central bank raises, cuts, or holds interest rates steady.
The scope difference: What counts as consumption spending
The Bureau of Labor Statistics publishes CPI, tracking the out-of-pocket spending of urban households. When a worker pays $500 per month for health insurance that their employer deducts from their paycheck, CPI registers that $500 as inflation. When the employer's share of that worker's health insurance costs rises from $1,000 to $1,200 per month, CPI ignores it entirely—the worker didn't spend their own money on it.
The Bureau of Economic Analysis calculates PCE, which includes that same household out-of-pocket spending plus employer-provided healthcare, employer payroll taxes for benefits, and government spending on medical services for individuals. When employer health insurance costs rise, PCE registers it as inflation. When Medicare pays more per patient for cardiology services, PCE captures it. When a company starts offering better dental coverage, PCE includes the cost increase.
Healthcare is one of the categories where PCE and CPI diverge most sharply. CPI counts only direct out-of-pocket medical spending—deductibles, copays, the portion of health insurance premiums workers pay themselves. PCE counts all healthcare consumption, whether households pay directly, employers subsidize it, or government programs fund it. When health insurance premiums, hospital rates, or drug prices surge, PCE catches the full impact. CPI captures only the slice that comes out of consumers' own wallets.
Shelter is another major source of divergence. Shelter carries a 34 percent weight in the CPI basket but only 16 percent in the PCE basket, because PCE includes more of services such as healthcare, financial services, and information and communication that CPI weights more lightly. This weighting difference is one reason CPI has historically run higher than PCE, since items that carry more weight in the CPI basket tend to pull its overall inflation rate upward relative to PCE.
The formula difference: How substitution gets captured
Beyond scope, the indexes use different formulas to combine prices into a single inflation number. The CPI uses a modified Laspeyres formula, which establishes a basket of goods at a fixed point in time and then tracks how much that basket costs over time. The PCE uses the Fisher-Ideal formula—specifically, a chain-weighted Fisher index. The difference matters because it determines how quickly each index responds when consumers change their behavior.
Imagine a real example. Beef prices spike 20 percent in a month due to cattle shortages. CPI includes beef at its historical weight in the typical household budget throughout that month and subsequent months. The index registers the full inflation impact of expensive beef because it assumes households continue buying beef at historical volumes. In reality, consumers shift immediately—they buy less beef, substitute chicken or ground turkey, or switch to cheaper cuts. But CPI's fixed basket doesn't capture that substitution until the annual weights update, which happens once per year.
PCE updates its expenditure weights monthly using a chain-weighting methodology. When beef prices spike, PCE detects within weeks that consumers are shifting to chicken and cheaper protein sources. It re-weights chicken upward and beef downward in its inflation calculation for the next month's release. PCE responds to consumer behavior in real time; CPI lags by up to a year. The result: PCE inflation runs lower and responds faster to what consumers actually do when facing price changes.
The difference is called 'substitution bias'—the tendency for fixed-weight formulas like CPI's to overstate inflation when consumers can switch between goods. During periods when some goods are becoming relatively more expensive than others, CPI overstates the true cost-of-living increase because it fails to account for the shifts consumers make. PCE's monthly chain-weighting substantially reduces that bias.
Historical performance and why the Fed made the switch
The divergence between the two indexes accumulates over time. In the 1990s, CPI ran about 0.7 percentage points higher annually than PCE. Since 2002, that gap narrowed to an average of 0.3 percentage points per year—but it still persists. Over the past 26 years since 2000, CPI inflation averaged 2.4 percent annually while PCE averaged 1.9 percent. That 50 basis point difference reflects CPI's heavier shelter weighting, its slower response to substitution, and its narrower scope that excludes employer and government healthcare spending.
The Federal Reserve recognized these differences decades ago. Former Chair Alan Greenspan began preferring PCE over CPI in the 1990s, and by 2000, PCE had become the Fed's informal inflation target. In January 2012, the Federal Open Market Committee formalized the switch by publishing its first 'Statement on Longer-Run Goals and Monetary Policy Strategy,' which set the Fed's 2 percent inflation target based explicitly on the PCE price index.
The shift reflected a core Fed insight: substitution happens fast, and an inflation measure that lags consumer behavior by a year misses the real trajectory of price pressures. If consumers switch to cheaper alternatives within days or weeks of price increases, but your inflation measure doesn't update weights for 12 months, you are systematically overstating inflation. Monetary policy set on an overstated inflation measure will be too tight, slowing growth and employment more than necessary.
The 2025-2026 divergence and what it means for policy
In 2025 and 2026, PCE and CPI diverged sharply, illustrating the practical policy consequences of the Fed's choice. Core PCE surged to 4.4 percent on a three-month annualized basis by March 2026, while core CPI remained relatively subdued. This 60 basis point gap represented one of the largest reversals since 1985, according to analysis from the investment manager PIMCO. The divergence reflected the three structural differences: PCE's broader healthcare weighting, its response to consumer substitution behavior, and its inclusion of non-out-of-pocket spending.
In July 2026, the Bureau of Economic Analysis released official data showing headline PCE at 3.70 percent year-over-year. That sat well above the Federal Reserve's 2 percent target. By September 2026, the Cleveland Federal Reserve's inflation nowcasting updated those figures, showing core PCE at 3.49 percent and core CPI at 2.39 percent—a 110 basis point spread. This gap helps explain why a Fed focused on PCE would have little appetite to cut interest rates even as CPI headlines suggested inflation was nearly tamed.
The same month of data produced opposite interpretations in financial headlines. News outlets leading with the CPI figure could accurately report that core inflation had fallen close to the Fed's 2 percent target. A policymaker reading PCE would see inflation still running about 149 basis points above target, with little reason to cut rates aggressively. Investors and policy watchers who focused only on CPI missed what the Fed was actually monitoring.
Why different groups care about different measures
PCE and CPI serve different purposes beyond monetary policy. The Social Security Administration indexes benefits to the CPI, not PCE. That means retirees' annual benefit increases follow CPI inflation, which since 2000 has averaged 50 basis points higher than PCE annually. Over a 20-year retirement, that compounds into meaningfully larger benefits than PCE-indexed adjustments would provide. Treasury Inflation-Protected Securities (TIPS) also adjust based on CPI, not PCE.
For businesses and investors focused on monetary policy, PCE is the relevant measure because it drives Fed decisions on interest rates. For workers and retirees tracking Social Security or TIPS returns, CPI is the relevant measure regardless of what the Fed targets. Understanding which measure applies to your situation prevents misinterpreting economic headlines.
What this means for reading inflation news
When inflation headlines hit, readers should now understand which measure is being reported and why that matters. CPI gets most media attention because it is released first and appears in most headlines. PCE arrives later but drives Fed policy. The two can move in opposite directions—CPI falling while PCE rises—producing conflicting narratives about whether inflation is solved.
Neither index is 'correct'—they answer different questions. CPI measures what it says: the consumer price index of out-of-pocket household spending. PCE measures what it says: personal consumption expenditures, including all forms of consumption spending. The question the Fed cares about is which inflation measure best guides monetary policy to achieve full employment and price stability over the longer run. For two decades and counting, it has decided that answer is PCE.
Readers interpreting inflation's impact on Fed decisions should track PCE, not CPI. When the Fed chair says inflation is above target, they mean PCE inflation. When the Fed projects rate cuts or hikes, those projections rest on PCE inflation forecasts. Reading PCE instead of CPI won't make inflation go away, but it will make Fed behavior make sense.