MarketsExplainer
Fed Raises Rates to 4%, Pushing Treasury Yields Above 5%
The Federal Reserve's first rate increase since 2023 lifted Treasury yields above 5% and signaled more tightening ahead, reshaping how investors value both bonds and growth stocks.
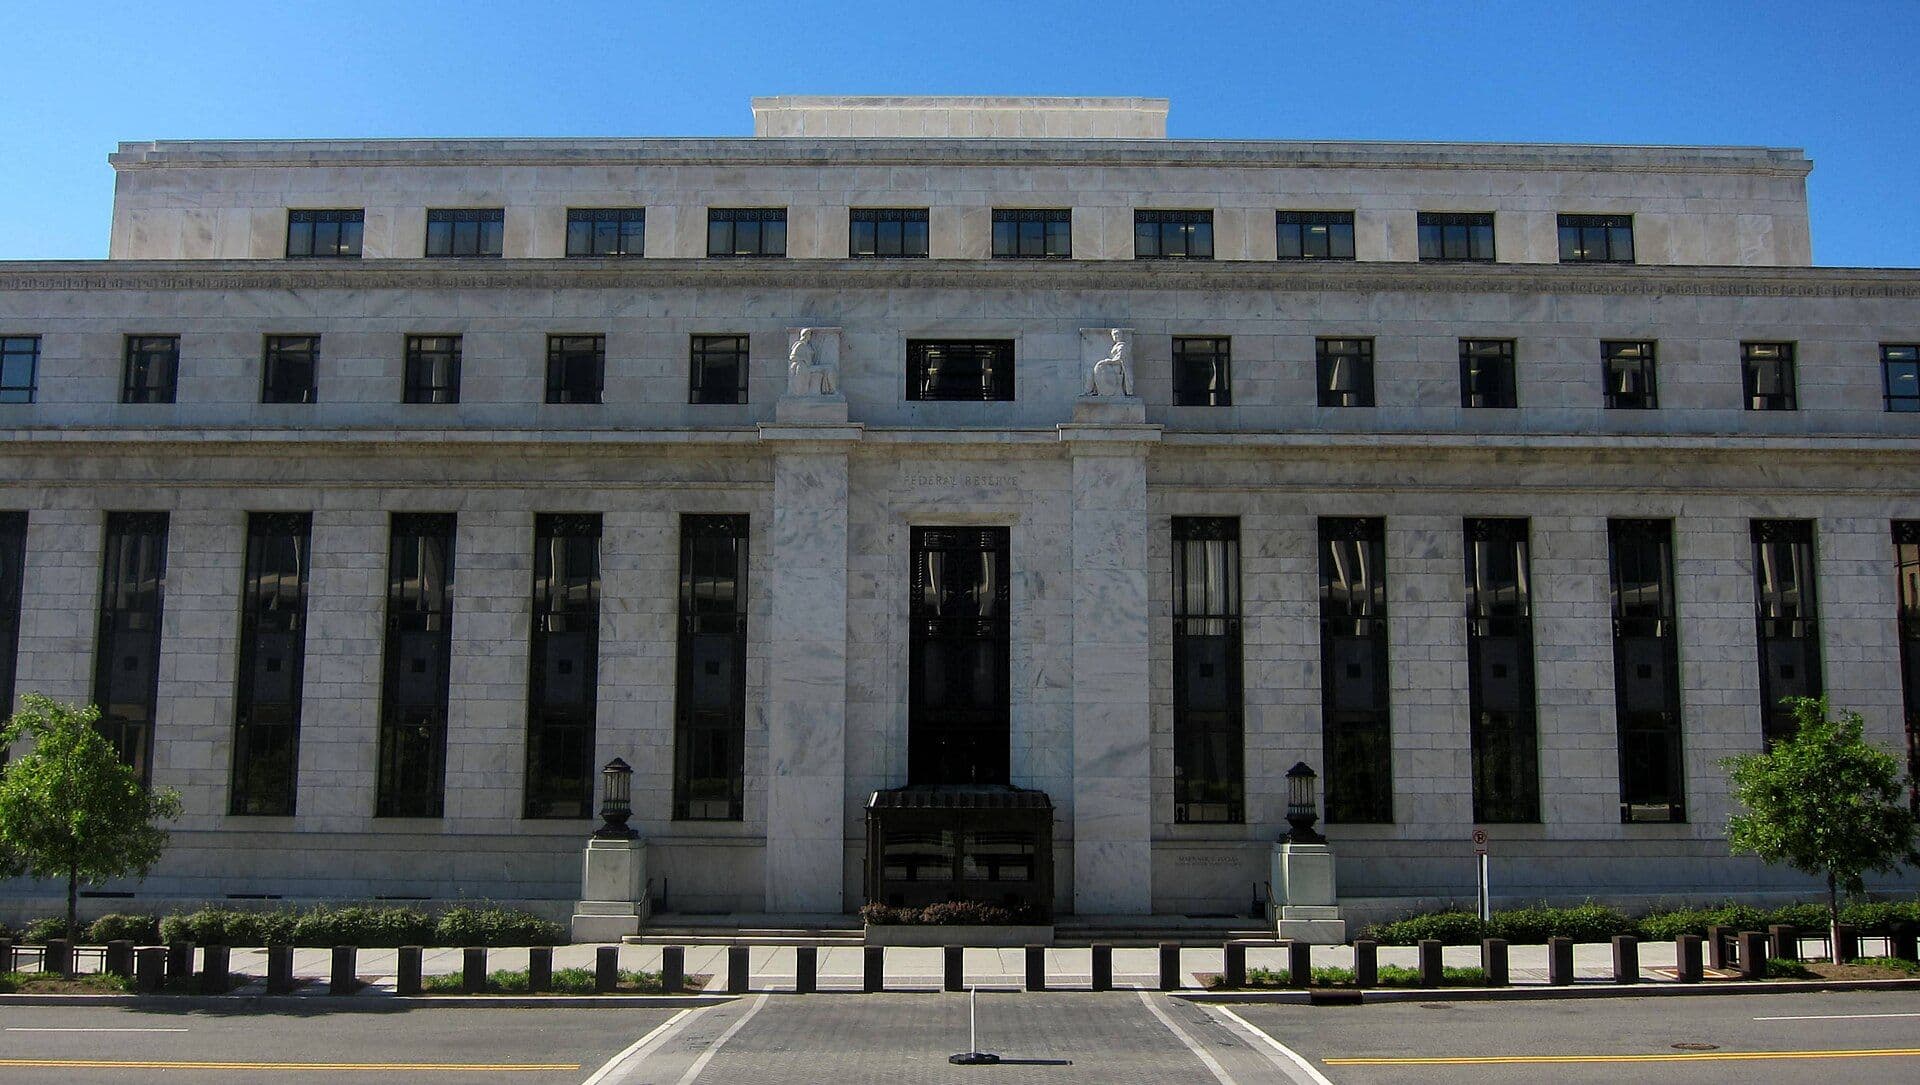
The Federal Reserve raised its benchmark interest rate by 25 basis points on September 16, 2026, moving the federal funds target to 3.75%-4.00%. The unanimous 12-0 vote marked the first increase since July 2023, following a policy pause that had held rates steady since late 2025. Within hours, the repricing accelerated across bond and equity markets as investors recalibrated expectations for future policy and rewove rate assumptions into asset valuations.
The hike was driven by stubborn inflation that the Fed's September projections placed at 3.6% for the personal consumption expenditures index in August, well above the central bank's 2% target. Oil prices and energy costs—the primary culprit behind the acceleration—fueled the urgency. Crude prices had risen from near $57 per barrel at the beginning of 2026 to a peak of $113 in April, before falling and surging back above $100 in early September. Fed Chair Kevin Warsh stated plainly: "Inflation is too high and has been for too long." The decision signaled a shift toward tighter policy, and investors faced a new calculus for portfolio positioning.
Why Energy Shocks Broke the Fed's Patience
Oil markets disrupted the Fed's patient stance in a single meeting cycle. Crude prices crossed $100 per barrel in early September 2026, while diesel prices surged to record highs above $6 per gallon. The resurgence in energy costs was driven by the escalating conflict with Iran.
The energy shock compounded an inflation problem that had already begun accelerating. The latest Consumer Price Index report showed prices rising 0.4% in August—the largest monthly increase in four months—even as the headline year-over-year rate stood at 3.4%.
The Fed's September 2026 projections reflected the revised inflation outlook. Officials projected headline PCE inflation at 3.7% for 2026, before easing to 2.3% in 2027. Markets had questioned the Fed's inflation-fighting credibility after the central bank held rates steady at its July meeting despite rising energy prices, essentially signaling patience at the wrong moment. The September hike was the Fed's correction.
The Immediate Repricing in Treasury Markets
Treasury markets absorbed the news with sharp repricing. The 10-year Treasury yield moved above 5% immediately after the announcement, reaching 5.016%. The 2-year Treasury yield, more sensitive to near-term rate expectations, rose 8 basis points to 4.74% on the decision day.
The rise to 5% on the 10-year marks a critical threshold for borrowing costs across the entire economy. Mortgage rates, corporate debt pricing, and municipal bond yields all calibrate against the 10-year Treasury as a benchmark. Homebuyers suddenly faced higher mortgage payments; companies refinancing debt had to accept higher coupons; pension funds and insurance companies holding long-duration bonds marked massive unrealized losses to market.
Higher yields mean lower prices for existing bonds, an immediate mark-to-market loss for holders of longer-duration securities purchased at lower yields. A bond purchased when 10-year yields were 3%, for example, loses value when yields rise to 5%. The price decline is steeper the longer the bond's duration, which is why 30-year Treasuries and long-dated corporate bonds tend to show larger losses than shorter-duration instruments in a rate hike.
How Equities Repriced on Growth, Duration and Discount Rates
Equity valuations adjusted along different fault lines according to how far earnings lie in the future. The S&P 500 fell 0.5% on the day of the announcement. The Russell 2000 small-cap index also fell 0.5%, showing broad-based repricing across market segments. Growth-oriented stocks—those trading on the expectation of earnings years or decades in the future—faced the sharpest repricing pressure.
The mathematics behind equity repricing centered on discount rates. Investors value stocks by discounting their future cash flows back to present value using a discount rate that includes a risk-free rate component (based on Treasury yields) plus a risk premium. When the risk-free rate rises from 3% to 5%, the present value of distant earnings falls sharply. A company expected to earn $1 in ten years, for example, is worth less today when the discount rate rises. The effect is magnified for growth stocks whose earnings are weighted more heavily toward the future.
Dividend stocks and companies with near-term earnings patterns proved less vulnerable. Cyclical sectors with nearer-term earnings streams face less valuation pressure from Fed tightening because a smaller portion of their total expected earnings lie in the distant future. Energy stocks, which benefit from higher oil prices, actually found support. Technology and high-growth stocks that depend on low discount rates faced the most pressure. Higher rates also increase borrowing costs for companies, reducing profit margins for businesses reliant on debt-financed operations.
What the Dot Plot Reveals About the Tightening Path
The Fed's dot plot—the individual rate forecasts submitted by FOMC participants—revealed broad consensus for additional tightening, but with notable divergence about its magnitude. Sixteen of the 18 participants projected at least one more 25-basis-point increase before year-end 2026. However, the distribution of forecasts exposed disagreement about the pace: 12 of the 18 saw an average appropriate rate of 4.125% for 2026, implying a single additional hike. Four participants projected 50 basis points of additional hikes—two more quarters—while only two believed no further increases were necessary this year.
The median projection placed the federal funds rate at 4.1% through 2027, suggesting the Fed anticipated holding rates steady after completing its 2026 adjustment. This is the critical number for investors. It means the Fed is not attempting an aggressive tightening cycle like those in 2022-2023. Instead, the 4.1% endpoint represents a measured, incremental path rather than a rapid climb; the Fed's own dot plot puts its longer-run rate estimate—often treated as a guidepost for neutral policy—lower, at 3.2%.
Markets interpreted the guidance as hawkish. Derivatives traders priced in roughly equal odds of a hold or another hike at the October meeting, but shifted higher conviction toward a December increase. Investors are pricing in three additional hikes by mid-2027, according to U.S. Bank. This path would place the federal funds rate near 4.75% within nine months. The discrepancy between the Fed's median projection of 4.1% and market pricing near 4.75% reflects uncertainty about whether the Fed will keep tightening beyond its stated comfort zone if inflation proves stickier than expected.
Portfolio Positioning for a Sustained Tightening Cycle
The cascade of expected hikes reshapes both bond and equity positioning for investors. In fixed income, investors in long-duration bonds face continued price pressure if Treasury yields rise further. The relationship is mechanical and inverse: if the 10-year yield rises another 50 basis points to 5.5%, the holder of a conventional 10-year Treasury bond purchased at par faces a 5% decline in principal value. If that investor must liquidate before maturity to raise cash, the loss is realized. Duration risk intensifies as the Fed signals multiple increases ahead.
Bond investors have three basic choices: shorten duration by moving into shorter-dated instruments like 2-year Treasury notes, accept the duration risk and price declines as the cost of carrying higher yields, or shift into floating-rate bonds whose coupons reset when rates rise. Floating-rate securities offer little initial yield because they adjust quarterly or semi-annually, but they eliminate duration risk. Mortgage-backed securities offer a different trade: prepayment risk rises when rates fall (bad for investors seeking yield), but declines when rates rise, providing a bit of price protection in a hiking cycle.
Equity investors must weigh sector rotation against growth company fundamentals. Companies with strong near-term earnings and pricing power—banks, energy producers, utilities, consumer staples—can offset valuation headwinds through earnings growth. Those dependent on low discount rates and distant growth—unprofitable technology companies, speculative biotech firms, long-duration growth plays—face renewed scrutiny. Share buyback announcements, a common use of corporate cash when valuations are attractive, may slow if corporate treasurers view stocks as expensive at current discount rates.
The median rate projection of 4.1% through 2027 is the signal investors should use for baseline positioning. If rates eventually settle near 4%, valuations should stabilize. If the Fed is forced to go higher—to 4.75% or above—then growth stocks face another leg of repricing. The September 16 move was not a shock event, but the beginning of a process. Portfolio managers are now positioned for a multi-quarter adjustment in how they value assets, with duration, growth exposure, and dividend yield becoming the central tensions in allocation decisions.
Related coverage: Why Rising Interest Rates Lower Stock Values and Bond Prices; How interest rate increases affect stock market valuations; One shipping route closes, oil prices spike, and inflation spreads globally.